
Unveiling the Magic of Descriptive Statistics: A Beginner’s Guide
Introduction
In the vast realm of data science, understanding the basics is the first step to unraveling its complexities. This article will be your guiding light into the world of descriptive statistics, offering clarity and insights for beginners and enthusiasts alike.
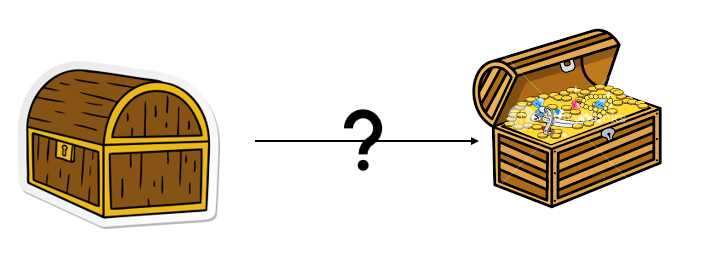
Imagine having a treasure trove of data, but not knowing how to make sense of it. Descriptive statistics are the key to unlocking this treasure, providing a lens to explore, summarize, and interpret data.
What are Descriptive Statistics?
| In the vast landscape of data analysis, descriptive statistics serve as the compass, guiding analysts through the intricate details of their datasets. At its core, descriptive statistics involve the exploration, summarization, and interpretation of data. It provides the foundational insights necessary to understand the characteristics of a dataset, offering a snapshot that aids in the broader analysis process. |  |
Importance in Data Analysis
| Descriptive statistics is the starting point for any data-driven journey. It allows analysts to grasp the basic features of data, providing a summary that simplifies the complexity inherent in large datasets. By distilling information into key metrics, descriptive statistics enable a more focused and efficient analysis, laying the groundwork for subsequent in-depth investigations. |

Key Measures of Central Tendency
Central tendency measures are the heartbeat of descriptive statistics, offering a central point around which data revolves. Three primary measures—mean, median, and mode—act as statistical compasses, guiding analysts through the center of their datasets.
Mean
The mean, or average, is the sum of all data points divided by the number of observations. It provides a balance point, making it particularly useful for datasets with symmetrical distributions.
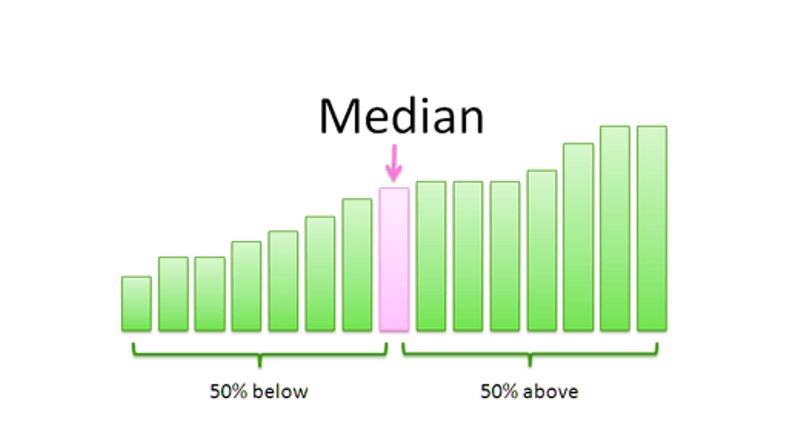
| Median The median is the middle value in a dataset when arranged in ascending or descending order. It is less influenced by extreme values, making it a robust measure, especially in skewed datasets. |
| Mode The mode represents the most frequently occurring value in a dataset. It is a valuable indicator for identifying peaks and patterns within the data. |

Dispersion Measures
Dispersion measures delve into the spread or variability of data points, offering insights beyond the central tendency. Three key measures—range, variance, and standard deviation—shine a light on the distribution’s breadth and consistency.
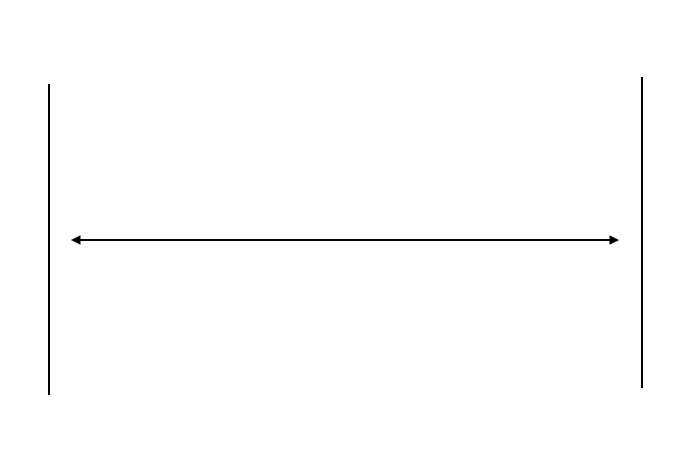
| Range The range is the difference between the maximum and minimum values in a dataset. It provides a quick overview of the data’s extent but is sensitive to outliers. |

| Variance Variance measures the average squared difference of each data point from the mean. It offers a more detailed understanding of data distribution. |
| Standard Deviation The standard deviation, a square root of variance, provides a more interpretable measure of data spread. It is widely used due to its sensitivity to variations |
Code
#Libraries
import statistics
import matplotlib.pyplot as plt
#Data
data = [12, 15, 18, 22, 25, 28, 31, 36, 40, 45]
#Central Tendency
mean = statistics.mean(data)
mediann = statistics.median(data)
modee = statistics.mode(data)
#Dispersion Measures
rangee = max(data) - min(data)
variancee = statistics.variance(data)
stdDevValue = statistics.stdev(data)


